AIDSVu has updated its interactive maps and data to include 2018 prevalence and new HIV diagnoses at the county- and state-level. The maps also include mortality data at the state level, showing rates and number of deaths that occurred among people with diagnosed HIV and comparison maps of social determinants of health – such as poverty, high school education, median household income, income inequality, and people without health insurance. There are also enhanced national, regional, state, county, and city data profiles.
Major data updates for 2020 include:
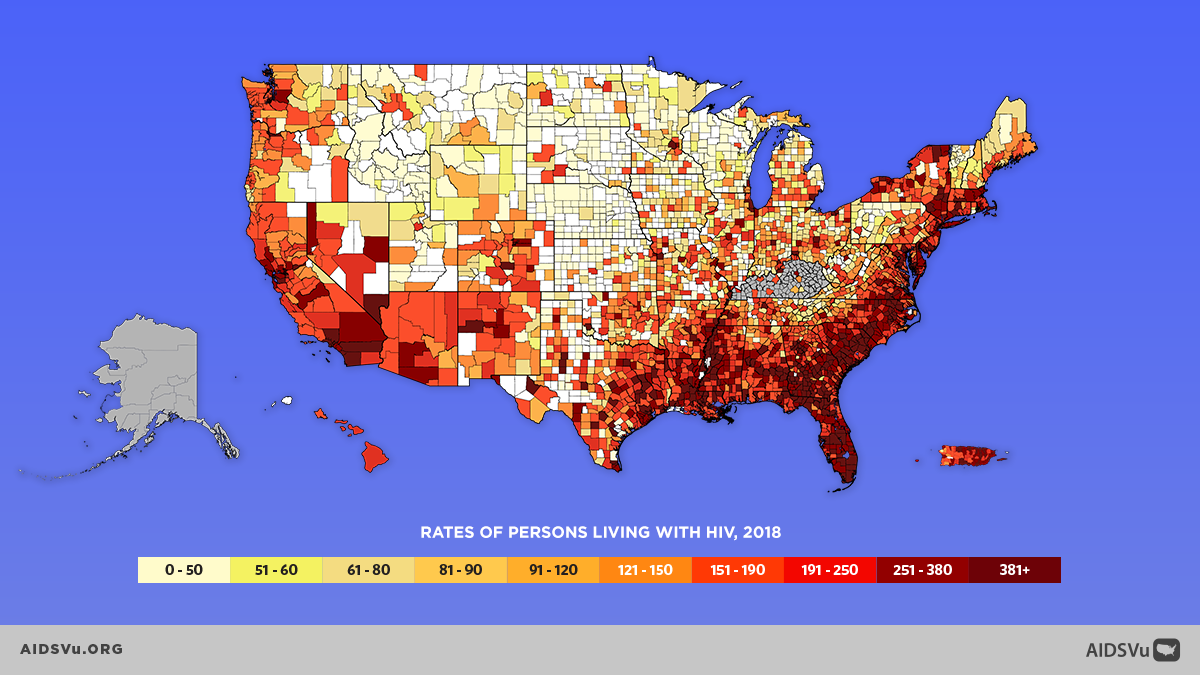
- State- and county-level data showing HIV prevalence (2018) and new HIV diagnoses (year-over-year from 2008 to 2018).
- Mortality data at the state level, showing rates and number of deaths that occurred among people with diagnosed HIV (2018).
- County-level PrEP rates and users data (2018), which can be stratified by age and sex.
- ZIP Code-level data showing HIV prevalence (2018) and new HIV diagnoses (2014-2018 five year cumulative) for over 45 U.S. cities.
- Comparison maps of social determinants of health – such as poverty (2018), high school education (2018), median household income (2018), income inequality (2018), and people without health insurance (2018).
- Enhanced national, regional, state, county, and city data profiles, including PrEP and HIV care continuum data, that are easy to download and print.
Find the maps on AIDSVu.org.