2020 04 22 09 58 39 NACCHO Coronavirus Resources for LH Ds

NACCHO Launches New Interactive COVID-19 Dashboard

Apr 22, 2020 | Taylarr Lopez

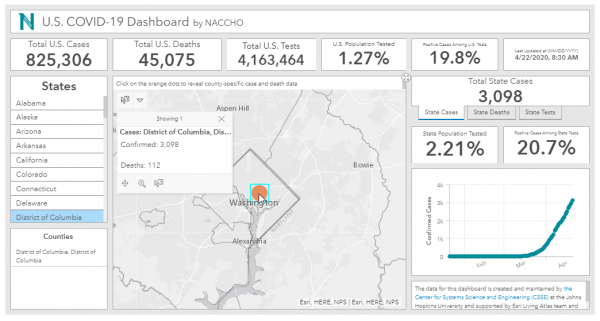
Accurate, timely, and localized data are crucial resources for local health departments’ (LHD) fight against COVID-19. On April 22, NACCHO launched its COVID-19 Data Lab, powered by Esri, to showcase available data that is geared toward the specific needs of LHDs. In this first iteration, LHDs will be able to utilize NACCHO’s new, interactive COVID-19 Dashboard to explore the extent of COVID-19 tests, cases, and deaths in their state and county.

Since the launch of this tool in April, NACCHO has made some updates:

  • June 9: NACCHO added new “Community & COVID-19 Dashboard,” highlighting select county and state-level data related to COVID-19 and local populations. Users can now view hospital and case data specific to counties, as well as testing and influenza-like illness data specific to states. These data are intended only as one resource to be used in coordination with other resources to make decisions about re-opening. In addition to the new dashboard, users are now able to download a .CSV file of the data presented on the “U.S. COVID-19 Dashboard.” With this new functionality, users can download the total case data from the previous 30 days for all U.S. states or just for a specific state. These updates offer more ways for users to explore and gain meaningful insights into the current state of COVID-19 in local jurisdictions.
  • May 8: NACCHO updated the dashboard to allow users to view the number of confirmed COVID-19 cases within the context of their county’s overall population, highlighting “hot spots” where the number of cases is high compared to the population. The data dashboard has also been updated for users to view the rise in confirmed cases within the last 30 days. Finally, data can now be viewed down to the Local Health Department jurisdictional boundary; however, please note that, particularly for city or multi-city health departments, data may not include accurate case counts in those states not reporting data to the zip code level. These updates offer more informative, meaningful insights into the current state of COVID-19 in local jurisdictions and can be used to inform official decisions on easing stay-at-home orders and re-opening local economies.

The data for this dashboard is updated multiple times a day and is created and maintained by the Center for Systems Science and Engineering (CSSE) at the Johns Hopkins University and supported by Esri Living Atlas team and JHU Data Services.

This lab will also house Esri’s impact planning reports for U.S. states, territories, counties, and municipalities. These reports help LHDs better understand the demographics of the communities that are currently being impacted, the number of cases, and the average number of hospital beds. All 3,220 reports are currently available and provide unique information to assist in the planning and response to COVID-19.

This lab will continue to grow as we develop more resources to assist LHDs through this epidemic.


About Taylarr Lopez

More posts by Taylarr Lopez

Related Posts

Philly MRC web main
  • Medical Reserve Corps

Fostering Volunteer Retention and Engagement through...

See how the Philadelphia Medical Reserve Corps builds and fosters connections...

Apr 18, 2024 | Beth Hess

Fostering Volunteer Retention and Engagement through...

I Stock 498649859
  • Funding Opportunity Health Equity & Social Justice

Request for Proposals: Website Developer for Health...

NACCHO is seeking a consultant to develop a dynamic website for NACCHO’s...

Apr 17, 2024 | Andrea Grenadier

Request for Proposals: Website Developer for Health...

Screenshot 2024 04 17 083518
  • Tools & Resources

NACCHO Website Gets a Fresh Look: Explore the Latest...

Check out the recent updates to NACCHO.org and explore the revamped website.

Apr 17, 2024 | Angie McPherson

NACCHO Website Gets a Fresh Look: Explore the Latest...

NAACHO Infographic1
  • Community Health Community Resilience COVID-19 Performance Improvement

COVID Workforce Project Infographics

Check out infographics designed as part of an initiative to highlight the...

Apr 11, 2024 | Andrea Grenadier

COVID Workforce Project Infographics

NAACHO Full Page Greene jpg Page 1
  • Community Health Community Resilience COVID-19 Performance Improvement

Listening to the Community and Co-creating Solutions...

Fewer than 12k people call rural Greene County home. It may be a small...

Apr 11, 2024 | Andrea Grenadier

Listening to the Community and Co-creating Solutions...

NAACHO Full Page Lewis Page 1
  • Community Health Community Resilience COVID-19 Performance Improvement

Building on Personal Relationships to Serve the...

Lewis County, KY, stretches across nearly 500 square miles of wooded hills and...

Apr 11, 2024 | Andrea Grenadier

Building on Personal Relationships to Serve the...

NAACHO Full Page Marietta Belpre Page 1
  • Community Health Community Resilience COVID-19 Performance Improvement

Carrying Forward Lessons Learned from the COVID-19...

Marietta/Belpre Health Department serves a rural population of roughly 20k...

Apr 11, 2024 | Andrea Grenadier

Carrying Forward Lessons Learned from the COVID-19...

NAACHO Full Page Tuscarawas Page 1
  • Community Health Community Resilience COVID-19 Performance Improvement

Identifying Partners to Reach Residents During the...

Tuscarawas County Health Department serves a population in the Appalachia...

Apr 11, 2024 | Andrea Grenadier

Identifying Partners to Reach Residents During the...

NAACHO Full Page Oneida Page 1
  • Community Health Community Resilience COVID-19 Performance Improvement

NACCHO’s COVID Workforce Project: Leveraging Community...

At Oneida County Health Department, cooperation is baked into daily operations;...

Apr 11, 2024 | Andrea Grenadier

NACCHO’s COVID Workforce Project: Leveraging Community...

Back to Top