This guest post was written by Marc Coudert from the Office of Sustainability at the City of Austin.
Rising temperatures across the globe is a consequence of climate change, and Austin, Texas, is no exception. By the mid-21st century, average annual temperatures in Austin are projected to rise about 2.7° F, and the number of days reaching at least 100° F will increase by 34 days annually. Already, though, high heat is having an impact on the health and well-being of Austinites: a report from Austin Public Health showed that in 2018, approximately 819 heat-related illnesses were recorded, along with four heat-related deaths. The heat is also affecting people’s ability to engage in health-promoting activities– approximately 70% of Austinites report that high temperatures prevent them from riding their bicycles.
To protect the communities and individuals from the health impacts of heat, the City of Austin is prioritizing heat mitigation efforts. Like most cities, lack of tree canopy cover and an abundance of imperious surfaces contribute to higher temperatures throughout Austin, which can be visualized through this Urban Heat Island Map. The City of Austin’s Office of Sustainability leads efforts to achieve a climate resilient and adaptive city, and was interested in understanding how they could address the issue of heat in an equitable manner.
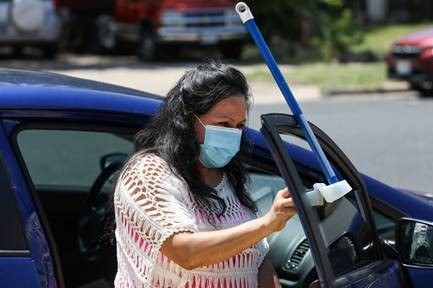
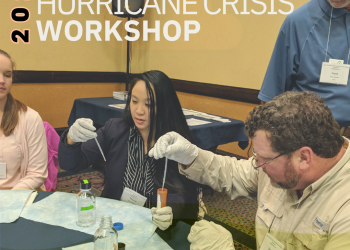
The City partnered with the University of Texas to create maps using data on climate indicators (including heat) and social vulnerability within the city. These maps helped identify areas that are disproportionately exposed to heat, and communities that are both more sensitive to heat and less able to respond and recover. Though this satellite data was insightful, the City of Austin wanted to understand what was happening on the ground using street-level data. To collect this, Austin’s citizen science members volunteered to drive around the City with heat sensors on their vehicles at different times throughout the day. Using this hyper-local data, maps of community assets, and social vulnerability index data, Austin would then be able to pinpoint future investment opportunities to ensure equitable distribution of heat mitigators.
In addition to the community members collecting lived experience, additional stakeholders in this process of determining best approaches to heat mitigation in Austin include three community organizers, four departments from the University of Texas at Austin, and over seven city departments. The City of Austin plans to pair the quantitative data that was collected with stories and input from community members to better understand how heat in Austin is affecting health, wellbeing, and access to locations such as schools, churches, bus stops, etc. In collaboration with community organizers and university faculty, the city is paying community members to provide stories of how heat impacts their daily activities. In turn, the city will work with all stakeholders to mitigate community heat by planting trees, install bus shelters, add new crosswalks, and other possible strategies provided by community members.